Short-term forecasts for the development of the epidemic in Poland after 26/10/2020
Compared to the analysis carried out two weeks ago, we observe a shift in the state of the epidemic deeper into the growth phase, mainly due to a decrease in contact reduction.
Epidemics in growth phase
The epidemic development model, developed by our group, takes into account, among others parameters such as degree of contact reduction (f), expressed as "by x%" relative to the observed frequency of contacts at the beginning of March 2020, and effectiveness of contact tracing (b), i.e. the probability of finding the source of infection and people who came into contact with the infected person and became infected in this way. In the heat map below, the most probable parameter pairs describing the dynamics of the epidemic at the moment are marked with an asterisk.
In comparison with the analysis carried out two weeks ago, we observe a shift in the state of the epidemic deeper into the growth phase, mainly due to a decrease in the degree of contact reduction.
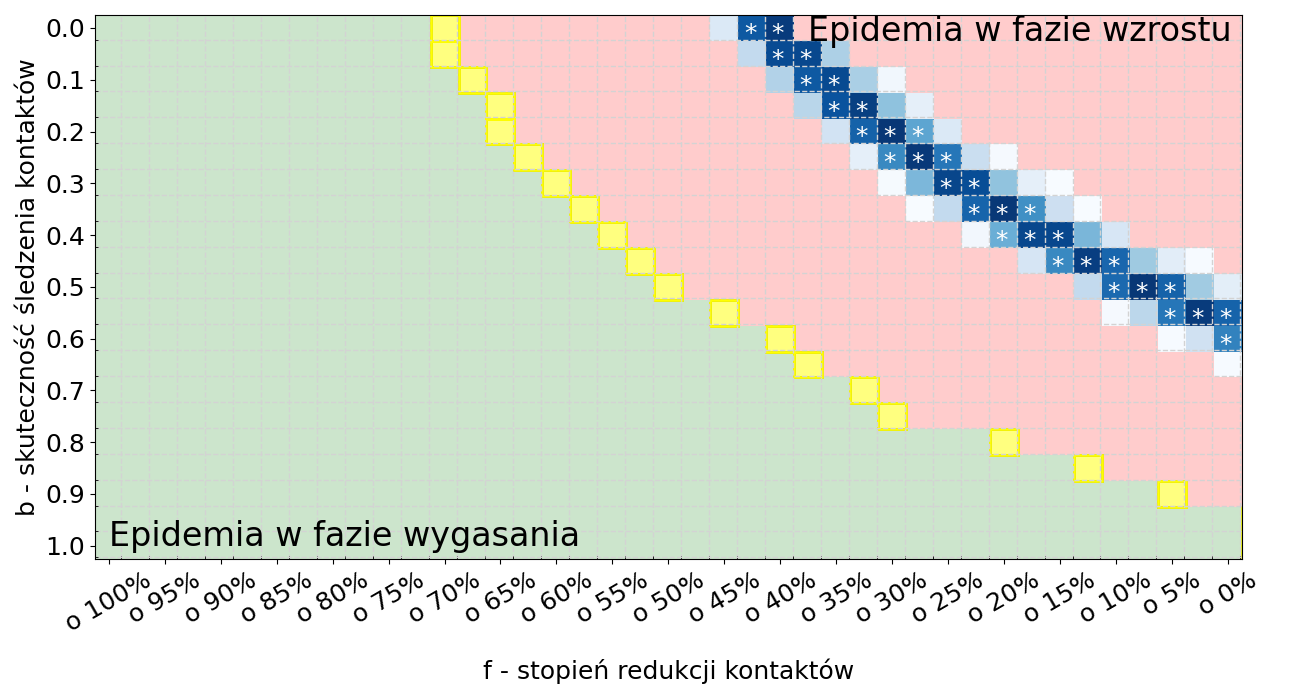 Drawing 1. Map of probable parameter configurations for the COVID-19 epidemic state in Poland on 26/10/2020. The shades of blue indicate the probable location of the parameter set. White asterisks mark places with the highest probability coefficients. Yellow indicates the critical line separating the epidemic in the extinction phase (green area on the left) from the epidemic in the growth phase (red area on the right).
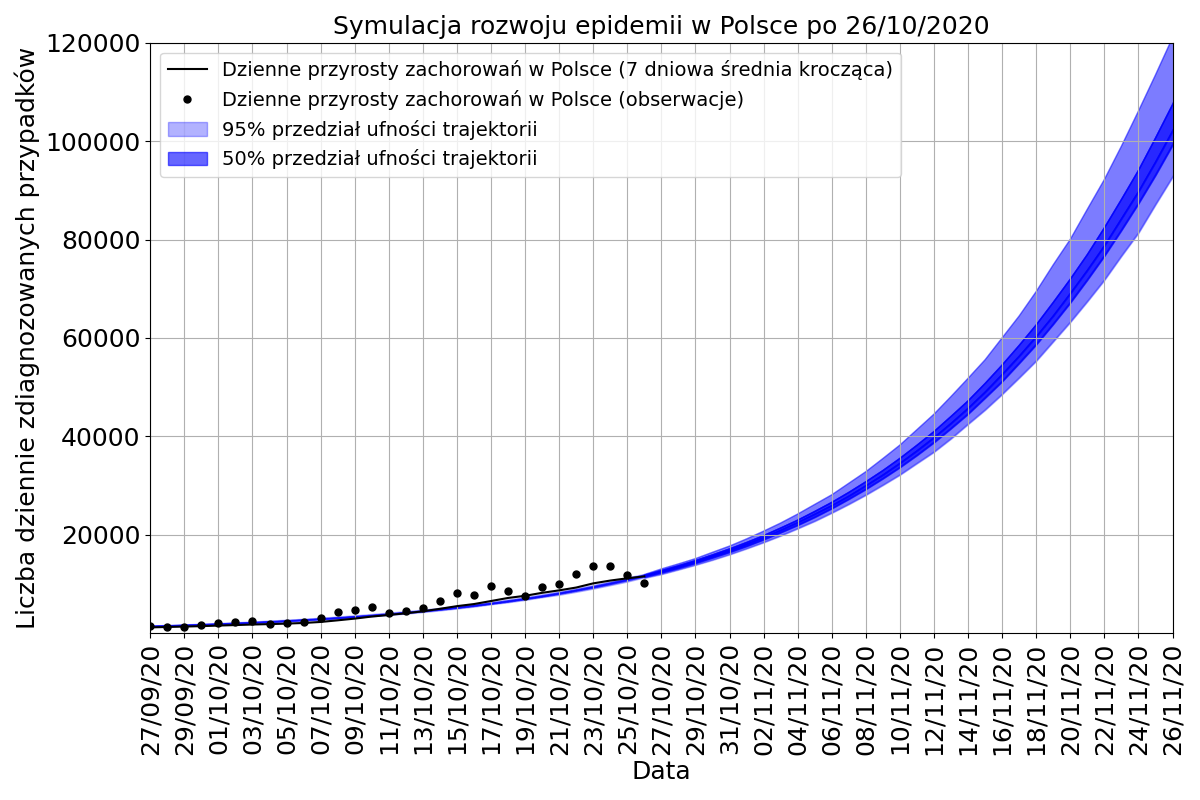
On the basis of the conducted analyses we conclude that with the current parameters describing the state of the epidemic, the daily number of new diagnosed cases per month will be 100 000 with a 50% probability.
Figure 2: Probable trajectories of the daily number diagnosed in Poland up to 26/11/2020. The dark blue area is determined by the 50% confidence level, while the light blue area is determined by the 95% confidence level. The observations are marked with black dots. The model has determined simulations of the development of the epidemic in Poland based on data from the last month up to and including 26 October 2020. The trajectories, on the basis of which the confidence areas were generated, were generated on the basis of a microsimulation model with a contact tracking module.