Short-term forecasts for the development of the epidemic in Poland after August 30, 2020
Until September 29, 2020, the 7-day average of daily new cases in Poland may increase to around 870 from the current level of around 730.
Until September 29, 2020, the 7-day average of daily new cases in Poland may increase to around 870 from the current level of around 730.
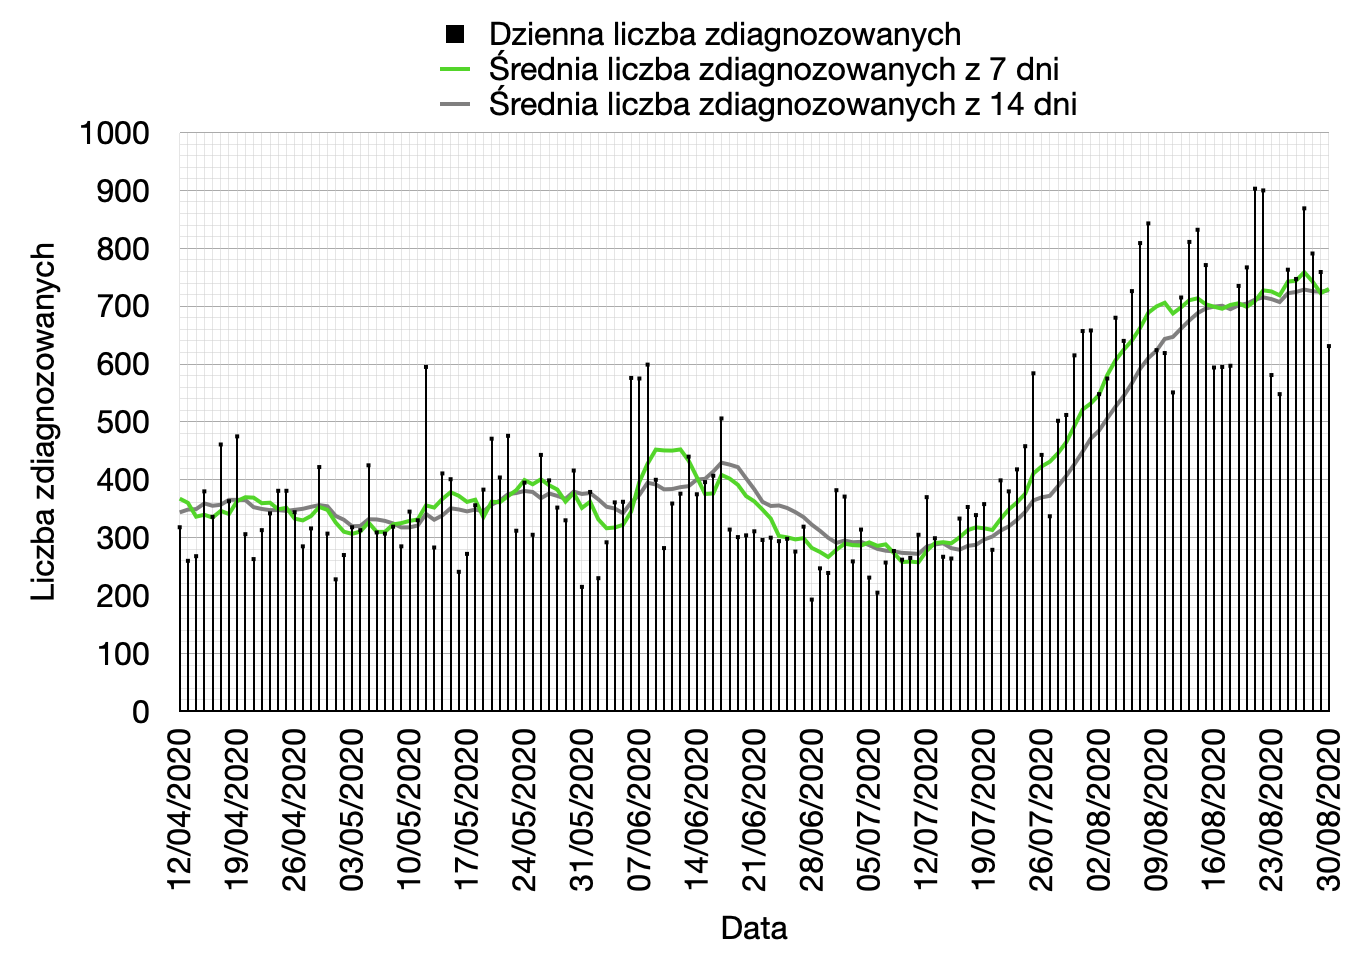 Fig.1. Number of new daily cases as well as 7 and 14-day rolling average of new cases from April 12, 2020 to August 30, 2020.
As of July 31, the 7-day mean daily increment in new cases increased from about 520 to about 730 on August 30.
If the current rate of growth does not change, then in the next month the 7-day average of daily increases in new cases will most likely increase to about 870 new cases per day (90% confidence interval for the 7-day mean is about (660, 1280)).