Short-term forecasts for the development of the epidemic in Poland after August 23, 2020
Until September 22, 2020, the 7-day average of daily new cases in Poland may increase to around 800 from the current level of 725.
Until September 22, 2020, the 7-day average of daily new cases in Poland may increase to around 800 from the current level of 725.
Since the first loosening of the restrictions announced at the end of April, the mobility of Poles has consistently increased from the level of -60% compared to the reference value, i.e. the level of mobility observed from the beginning of the year to mid-March, and has remained at the level of + 70-80% of the value since mid-July[1]. At the same time, from mid-July to approx. August 10, we observed a strong increase in the daily increase in new cases, which significantly slowed down over the past two weeks.
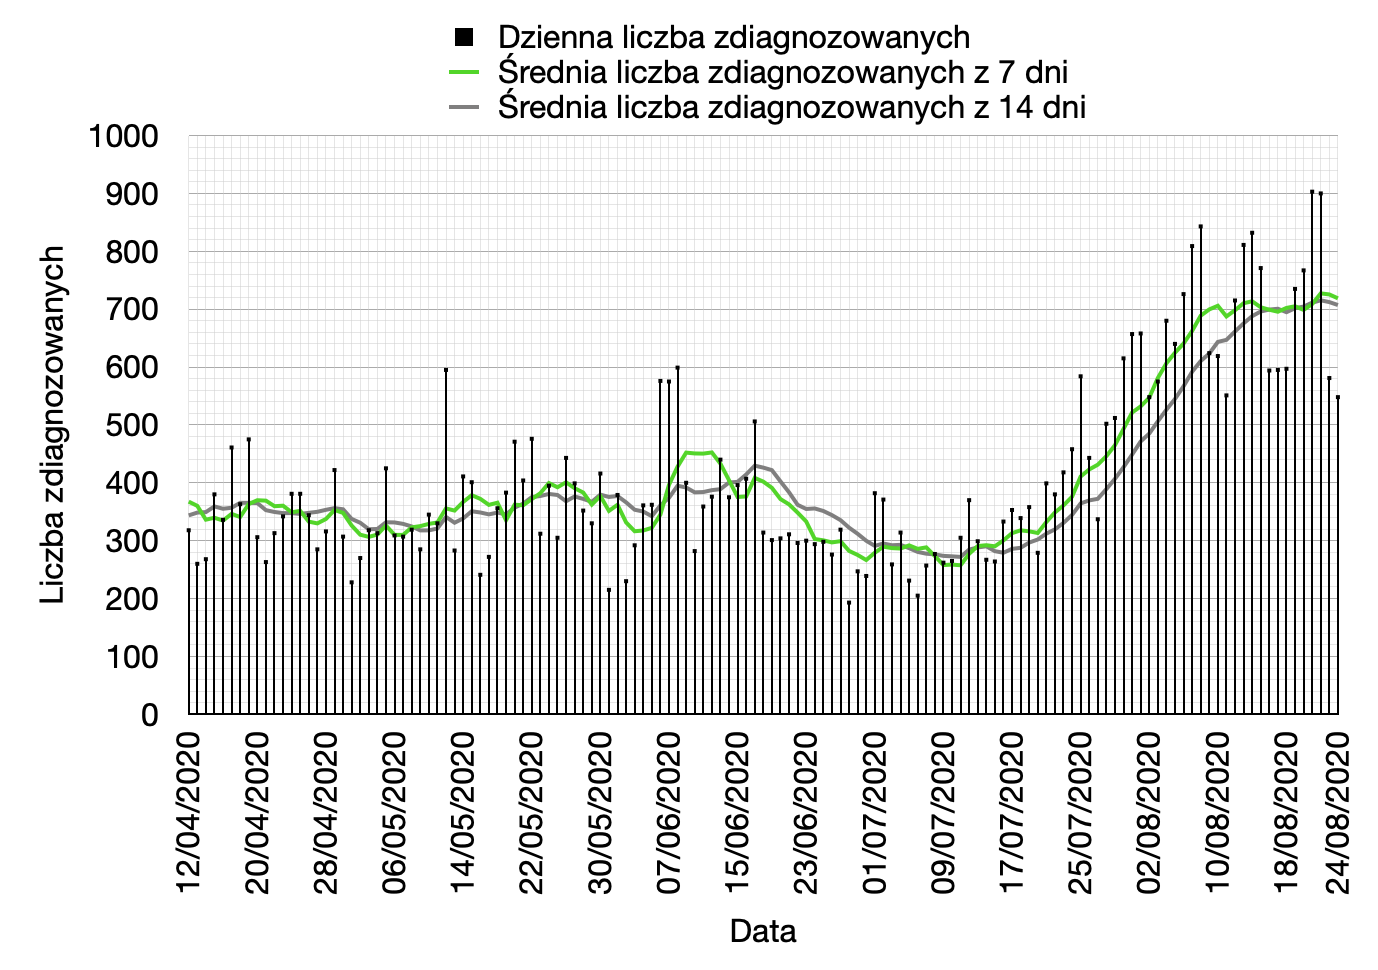
Fig.1. Number of new daily cases as well as 7 and 14-day rolling average of new cases from April 12, 2020 to August 24, 2020.
As of July 24, the 7-day mean daily increment in new cases increased from 375.86 to 725.43 on August 23.
If the current rate of growth does not change, then in the next month the 7-day average of daily increases in new cases will most likely increase to about 800 new cases per day (90% confidence interval for the 7-day mean is about (600, 1200)).